Lupine Publishers |Agriculture Open Access Journal
Abstract
The study analyzed the household poverty status of small scale
farmers in Bayelsa State, Nigeria using a multi-stage random
sampling technique to sample six hundred farmers. Data were collected
using structured questionnaire and were analyzed using
descriptive statistics, FGT [1] index and the logistic regression model.
The result revealed that the majority of the farmers 80% were
females, while 79% of the respondent was married with 46% of them having
no formal education. Twenty-seven (27) percent of the
crop farmers are poor while thirtyeight (38) of the livestock farmers
were poor. Also, the poverty depth and severity of crop farmers
were 0.072 and 0.038 respectively whereas they were 0.098 and 0.052
respectively for the livestock farmers. The logistic regression
model revealed that age, educational level, household size, farming
experience, farm/herd size, household income, household
expenditure and membership of cooperative contributed significantly in
determining the poverty status of the farmers. This study
therefore recommends measures needed to be put in place to encourage and
improve the welfare of the farming household towards
productive and sustainable agricultural development for poverty
reduction.
Keywords: Economic; Poverty; Status; Small Scale; Farmers
Introduction
Nigeria is a vast country endowed with substantial natural
resources which include; 68 million hectares of arable land,
fresh water resources covering about 12 million hectares, 960
million hectares of coastline and ecological diversity that favor
the production of a wide variety of crops, livestock, forestry and
fisheries product [2]. These coupled with its 37 million hectares of
natural forest and rangeland and total land mass of 923,768km2 [3]
makes agriculture one of the prominent sub-sector. In spite of these
resources’ endowment, the productivity of agriculture continues to
dwindle. One of the major problems confronting Nigeria today is
how to improve the quality of life in the rural areas and reduce the
level of poverty [4]. Poverty in Nigeria is not only a state of existence
but also a process with many dimensions and complexities [5]. The
report of the 2006 Nigerian Core Welfare Indicator (CWI) on the
poverty profile in the country stated that the dependency ratio,
which was defined as the total number of household members aged
0 – 14 years and 65 years and above to the number of household
members aged 15 – 64 years was 0.8 Central Bank of Nigeria [6].
This indicated that almost a one-to-one dependency ratio and
reflected the high population growth rate in the country. There
is also large income inequality with the top 10% of the income
bracket accounting for close to 60% of the total consumption of
goods and services [7].
The World Bank [8] describes poverty to comprise of many
dimensions. It includes low incomes and the inability to acquire
the basic goods and services necessary for survival with dignity.
It encompasses low levels of health and education, poor access to
clean water and sanitation, inadequate physical security, lack of
voice and insufficient capacity and opportunity to better one’s life.
It may also result in not having enough capacity to feed and clothe
the family and/or earn a living. About 90% of the country’s food is
produced by small scale farmers cultivating tiny plots of land who
depend on rain fed agriculture [9]. According to Omonona [10],
poverty is pervasive although the country is rich in human and
material resources that should translate into better living standard.
Despite its plentiful resources and oil wealth, poverty is widespread
in Nigeria [11]. The situation is said to have worsened since the
late 1960s, to the extent that the country is now considered one of the
20 poorest countries in the world. Over 70% of the population
is classified as poor, with 35% living in absolute poverty. Poverty
is especially severe in the rural areas, where social services and
infrastructure are limited or non-existent. Majority of those who
live in rural areas are poor and depend on the agriculture for food
and income.
The concern on the threat posed by poverty has led the Nigerian
government over the years to devote considerable attention
to alleviating its scourge through various policy projects and
programmes which seems not to have stem the ugly situation till
date. In view of these, the question about the poverty status of rural
dwellers especially the small scale farmers remained unanswered.
It is on this premise that this study was carried out to answer these
questions.
a) What are the socio-economic characteristics of these
small scale farmers?
b) Are the small-scale farmers really poor?
c) What are the factors influencing poverty status of the
small scale farmers? and
d) What options are available to small scale farmers in
reducing their poverty levels?
Thus, the main objective of this study is to evaluate the poverty
status of small scale farmers in Bayelsa State, Nigeria. The specific
objectives are to:
a) Describe the socio-economic characteristics of small scale
farmers.
b) Compare the poverty status of crop and livestock farmers
in the study area;
c) Determine the factors influencing poverty status of the
farmers; and
d) Make policy suggestion towards poverty alleviation.
Methodology
Study Area
The study was conducted in Bayelsa State, Nigeria. It is located
between latitude 5° 001 to 10° 301 N and longitude 4° 551 to 6° 001 E
and covers an estimated land area of 1,810km2 with a population of
about 856,729 thousand [12]. It shares local boundary with Delta
State, Anambra State and Rivers State with the Bight of Benin at
the Southern Flank. There are eight (8) Local Government Areas
(LGAs) in the state with Ijaw as their major language. Mean annual
rainfall of the area is 2,200mm for upland or dry regions where
water bodies are few and 3,500mm for wetland or lowland region
which comprises of land areas being surrounded by water bodies.
Temperature range is between 23 – 31°C and vegetations found in
the area include the saline water swamp, mangrove swamp and
the rain forest. Major seasons are the dry (November – February)
and wet seasons (October – March). Also, the seasonal condition of
the area presents a healthy environment for farming which is the
main source of income and livelihood of the state’s population and
agriculture accounts for about 72% of the labor force.
Sampling Procedure and Sample Size
The sampling involved a multistage random sampling technique.
Firstly, six (6) local government areas were randomly selected using
the proportionate sampling method at 75% precision level from
the purposively selected three (3) agricultural zones according
to Agricultural Development Programme (ADP) structure. In the
second stage, ten (10) villages were also randomly selected from
the six (6) LGAs each making a total of sixty (60) villages. The third
stage involved a simple random selection of five (5) crop and five
(5) livestock farmers each from the villages using the list provided
by ADP from each of the villages. A total of six hundred (600)
respondent farmers were used.
Data Collection
Both primary and secondary data were used for the study. The
collection of primary data was achieved using a set of structure
questionnaire that was administered by the researcher and trained
enumerators complemented with oral interview, information that
was collected covered the areas of socio–economic characteristics,
farming operations, and income and expenditure patterns.
Secondary data were sourced from relevant material both published
and unpublished.
Analytical Technique
Three analytical tools namely; descriptive statistics; Foster,
Greer and Thorbecke (FGT) model of poverty decomposition [1];
Logistic regression were used for the study. Descriptive statistics
such as frequency, percentages, mean were used to profile the
socio-economic characteristics of the farming households and also
to present the results of the findings. The FGT measure was used to
assess the incidence, depth and severity of poverty of the farming
households. The approach makes use of the aggregate values of
the poverty indices – poverty headcount, poverty gap, and squared
poverty gap. The use of the FGT measures required the definition of
poverty line and this was calculated on the basis of aggregated data
on household income. The FGT measure as used by Baiyegunhi and
Fraser [13] is expressed as:
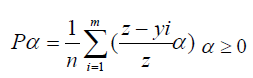
Where:
z = Poverty line
m = Number of households below poverty line
n = number of households in the reference population
yi = Per adult equivalent income of ith household
α = Poverty aversion parameter
z-yi = Poverty gap of the ith household
z – yi = Poverty gap ratio
The headcount index was obtained by setting a = 0, the yield
poverty gap index when a = 1, and squared poverty gap index when
a = 2. The poverty line is a predetermined and well defined standard
of income and value of consumption. In this study, the poverty line
was based on the income of the households. A relative poverty line
was used in which a household was defined as poor relative to others
since they are all farmers. Two third of the mean per capita income
(MPCI) was used as a moderate poverty line while one third was
taken as the line for extreme poverty. Thus, the farming households
were grouped into three categories based on their levels of poverty:
the extremely poor (those whose income was less than one-third of
MPCI), the moderately poor (those whose income lies between onethird
and two-third of the poverty line) and the non-poor (those
whose income was above two-third of the poverty line).
Adult equivalents were generated following Nathan and
Lawrence [14], thus:
AE =1+ 0.7(N1 −1) + 0.5N2
Where
AE = Adult equipment
N1 = Number of adults aged 15 years and above
N2 = Number of children aged less than 15 years.
Logit Regression Model
A binary logistic regression model was used to analyze the
determinants of poverty. Thus, poverty is the dependent variable
and is determined by independent variables such as socioeconomic
characteristics of households and access to services. The
dependent variable is binary (1 if the household is poor and 0 if the
household is non-poor). The logit model is based on the cumulative
logistic distribution function expressed as:
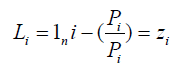
Where:
Li = log of the odd ratio, which is not only linear in Xi but also
linear in the parameters,
Pi = is the probability of being poor and ranges from 0 to 1.
Zi = the function of the explanatory variables (x) which is
expressed explicitly as:

Where:
Bo = Intercept, Bi – B9 = coefficient of the independent variables,
xi = is the vector of relevant independent variables and U = is the
stochastic error term, z = the dependent variable defined as the
mean annual per capita expenditure. It was measured in binary
terms such that 0 = poor, that is if the mean per capita household
expenditure is below the poverty line and l = not poor, that is if the
mean per capita household expenditure is above the poverty line
and:
X1 = Age (number)
X2 = Farm size (number of herds/hectares)
X3 = Marital Status (1 = Married, 0 = otherwise)
X4 = Household size (number)
X5 = Education Level (number of years)
X6 = Major Occupation (1 = farming, 0 = otherwise)
X7 = Farming Experience (years)
X8 = Household income (Naira)
X9 = Household Expenditure (Naira)
X10 = Extension contact (1 = yes, 0 = otherwise)
X11 = Cooperative Membership (1 = yes, 0 = otherwise)
Results and Discussion
Socio-Economic Characteristics of Respondents
Table 1 shows the socio-economic characteristics of the
respondents. The majority, 80.3% of the respondents were female
while 19.7% were male. This suggest that majority of small scale
farmers in the study area are female. About 61% of the respondent
were age <30 to 50years with the mean age of 41 years. These
results suggest that majority of the farmers were in their active
productive age. Moreover, 79.17% of the respondent farmers were
married, only 14.83% were single and 6.00% of the farmers were
either divorced or widowed. About 46.50% of the farmer does
not have formal education, while 32.67% had primary education.
Only 16.17% and 4.67% of the respondents had secondary and
tertiary education respectively. These result confirm the low
level of education in the study area as the state was rated as
an educationally disadvantage state in Nigeria. Majority of the
respondent farmers 65.67% had a household size ranging between
6 – 10 persons, while 11.50% had less than 5 persons and 22.83%
of the respondent had above 10 persons. The result suggests a large
household size among the respondent farmers (Table 1).
Table 1: Socio-Economic Profile of Respondents.
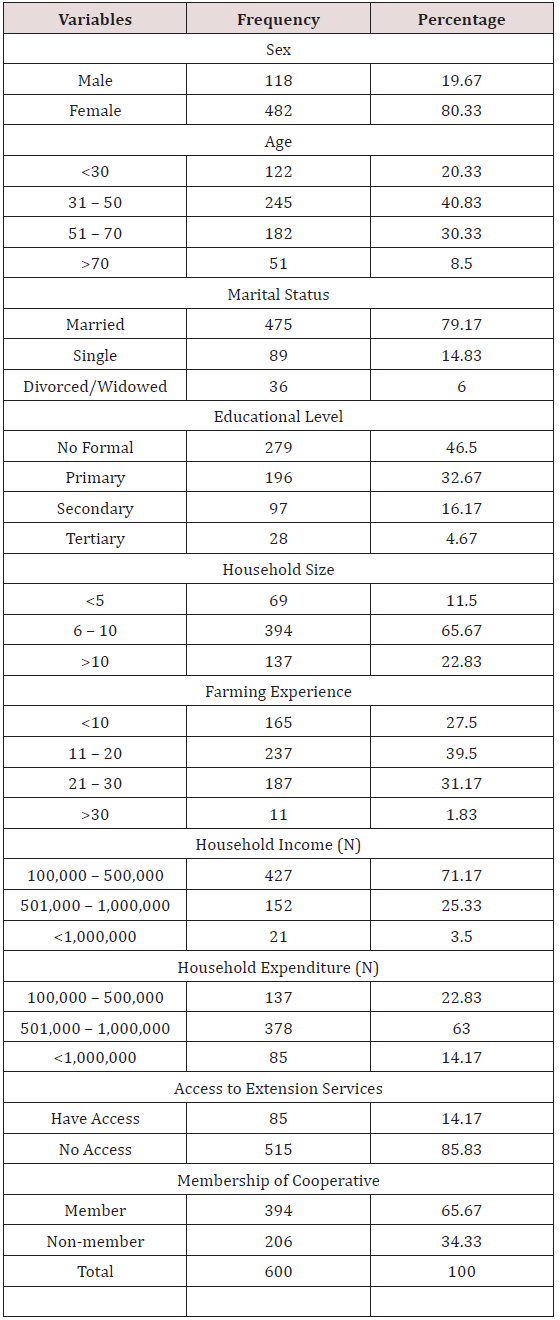
On the basis of farming experience, about 27.50% of the
respondents had less than 10 years farming experience, while
39.50% had farming experience ranging between 11 – 20 years.
Only 31.17% had farming experience ranging between 21 – 30 years
and 1.83% had farming experience of more than 30 years. Based on
household income, about 71.17% of the respondents had annual
income ranging between N100,000 – N500,000, while 25.33%
had annual income ranging between N501,000 - N1,000,000, only
3.50% of the respondents had annual income above N1,000,000.
Majority of the farmers 63.00% had household expenditure ranging
between N501,000 – 1,000,000, while 22.83% had expenditure
ranging between N100,000 – N500,000 and 14.17% of the farmers
had household expenditure above N100,000. These result suggest
that majority of the respondent farmers spend more than they earn
thereby pushing them more into poverty. Majority of the farmers
85.83% have no access to extension services while only 14.17% of
the farmers have access to extension services. Moreso, 65.67% of
the respondent farmers are members of cooperative societies while
34.33% do not belong to cooperative society (Table 2).
Table 2: Poverty Incidence, Depth and Severity of Respondents.

Analysis of Poverty Status of the Farmers
Table 2 shows the summary of the poverty incidence (P0), depth
(P1) and severity (P2) among the respondents. The MPCI of the crop
farmers was 21,017.20. This gives a moderate poverty line (2/3
MPCI) of 14,011.47 and a core poverty line (1/2 MPCI) of 7005.73.
The MPCI of the livestock farmers was 17,213.10. This gives a
moderate poverty line (2/3 MPCI) of 11,475.40 and a core poverty
line (1/2 MPCI) of 5737.70. Hence, crop farmers whose monthly
per capita income falls between 14,011.47 and 7005.73 were
regarded as moderately poor while those who fall below 7005.73
were regarded as core poor and those above 14,011.47 were
regarded as non-poor. For the livestock farmers, households whose
monthly per capita income fall between 11,475.40 and 5737.70
were regarded as moderately poor while those below 5737.70 were
regarded as core poor and those who are above 11,475.40 were
regarded as non-poor. The poverty incidence (Table 2) shows that
among the crop farmers, 27% of the populations were poor while
among the livestock farmers, 38% of the populations were poor.
The poverty depth of the crop farmers and livestock farmers was
0.072 and 0.098 respectively. This implies that they would need to
be increased by 7.2% and 9.8% respectively for them to come out of
poverty and become non-poor. The poverty severity measures the
distance of each poor person to another. Among the crop farmers,
the distance was 0.038 while in the livestock farmers the distance
was 0.052. Overall, a comparison of the poverty status of the crop
and livestock farmers indicated that the poverty status is relatively
close even though it is higher among livestock farmers. The result
may not be unconnected to excessive expenditure incurred by head
of household as a result of increase household size and low-income
occasion by subsistence nature of farming.
Factors Influencing Poverty Status of the Respondents
Table 3 shows the factors influencing poverty status of the
farmers. The regression classification table revealed that the binary
logistic model predicted 97% of the regression correctly. The model
fits the data at (P<0.001) as indicated by the chi-square goodness of
fit statistic (73.28). The goodness of fit of the model proved that the
variables tested in this study were valid to explain the determinants
of poverty in the study area. Besides, the Nagelkerte R2 value (0.867)
shows that about 87% of the outcome (Likelihood of being poor)
can be explained by the selected independent variables captured in
the model (Table 3).
Table 2: Logistic Regression Result on Factors Influencing
Poverty Status of the Respondents.
Percentage Prediction = 97.57%
Goodness of fit chi-square (df=11) = 73.28 (P<0.001)
Nagelkerte R2 = 0.867
***, ** and * = figures significant at 1%, 5% and 10% levels
respectively.
Source: Computation from field survey data, 2017.
The results of the regression model indicated that eight (8)
of the eleven (11) explanatory variables influenced the poverty
status of the farmers. The variables were age, educational level,
and household size, farming experience, farm/herd size, household
income, household expenditure and membership of cooperative.
The coefficient of age of the farmer was significant and negatively
related to the probability of a household becoming poor. This
implies that the age of the farmers is a causative factor of poverty.
As age of the farmers increase, the likelihood of being non poor
is reduced. This conforms to a priori expectations and work by
Ayalneh [15], Obiesesan [16], who opined that older households
had greater likelihood of being non-poor. This may be attributed
to increased experience and exposure to farming operations and
management practices as their age increases.
A positive and significant relationship was found between
educational qualification and the likelihood of being non-poor,
hence, the higher the educational level, the lower the tendency
of been poor. The result is in conformity to a priori expectations
and work by Ogwunike [16] who found that a positive significant
relationship existed between educational level and the probability
of being non-poor. The coefficient of household size was negative
and was significant at 1% level. This implies that, the higher the
household size, the more likely to become poor. Ceteris paribus.
This could be as a result of the fact that the members of such
households would have to depend on the limited resources that is
available to the household thereby reducing the per capita income
of the household. This is in agreement to a priori expectations and
work by Khan [5] and Ogwumike [16].
A positive and significant relationship was found between
farming experience and the likelihood of being non poor at 5%
level. This implies that the higher the years of farming, the higher
the probability of being non-poor. This is in conformity to a priori
expectations and work by Omonona [10] who stated that exposures
and experiences gathered over the years help rural poor people to
fight poverty. The author further opined that experience in farming
help to reduce losses thereby encouraging proper handling and
management of relatively scarce resources. There was a positive
and significant relationship between farm/herd size and the
likelihood of being non-poor. This implies that as the farm/herd size
of the farmer increases, the probability of the household being nonpoor
is increased. This finding conforms to a priori expectations
and work by Eneyew [17] and Alemu [18] who found that a unit
increase in land holding increased the probability of being nonpoor.
The coefficient of household income was significant at 1%
level and positively related. This implies that as the household
income increase, the probability of being non-poor increases. This
is in agreement to a priori expectations and work by Alemu [18]
who found a positive relationship between household income and
the likelihood of being non-poor.
In conformity to a priori expectations, the coefficient of
household expenditure was negative and significant at 5% level.
This indicated that, the higher the household expenditure, the
lower the likelihood of being non-poor. Ogwumike [19] stated that,
excessive expenditure by household head is a pointer to poverty.
The coefficient of membership of cooperative was positive and
significant at 5% level. This implies that, if a household head is a
member of cooperative, the likelihood of being non-poor increases.
This will not be unconnected with the fact that members of
cooperative in the rural settings help their cooperative members in
time of needs and also provide incentive and loan facilities to those
in need.
Conclusion
The research has shown that, the incidence, depth and severity
of poverty were high among the farming households even though
some of the farmers fall above the poverty line. The study has also
shown that the rate of poverty is relatively higher among livestock
farmers compared to crop farmers. Meanwhile, the study has
revealed that several factors influences the poverty status of the
farming households such as age, educational level, household size,
farming experience, farm/herd size, household income, household
expenditure and membership of cooperative [20].
Given these findings, therefore, it is recommended that:
a) Government and other relevant non-governmental
organizations should provide incentives and infrastructures
that will enhance productive and sustainable agricultural
development in the rural areas.
b) The farming households need to diversify their productive
activities through mixed farming and value addition to improve
their non-farm income thereby reducing poverty.
c) Policy makers and the operators of rural economy should
carefully understand those variables that influence the poverty
status of the farming households and address them critically
and vigorously.